Sea ice

A huge temperature rise threatens to unfold soon

By |2023-01-03T08:28:19+00:00January 3rd, 2023|

A huge temperature rise threatens to unfold, as the already dire situation threatens to turn catastrophic due to the combined impact of a number of developments and feedbacks. 

The upcoming El Niño

Temperatures are currently suppressed as we’re in the depth of a persistent La Niña event. It is rare for a La Niña event to last as long as the current one does, as illustrated by the NASA image below and discussed in this NASA post.  

The above image also indicates that a strong El Niño has become more common over the years. The above image was created using data up to September 2022. La Niña has since continued, as illustrated by the NOAA image on the right. NOAA adds that the dashed black line indicates that La Niña is expected to transition to ENSO-neutral during January-March 2023.

Chances are that we’ll move into the next El Niño in the course of 2023. Moving from the bottom of a La Niña to the peak of a strong El Niño could make a difference of more than half a degree Celsius, as illustrated by the image below.
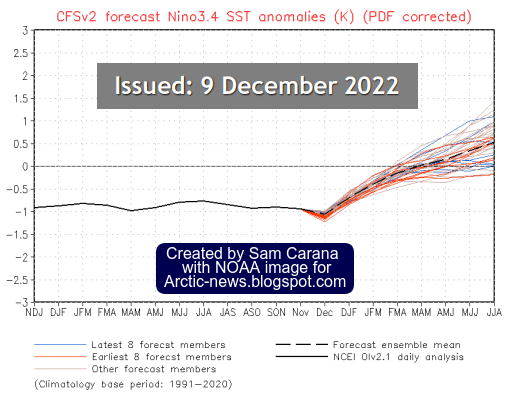
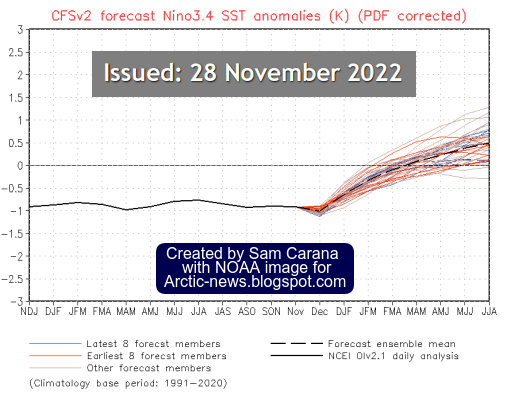
[ image adapted from NOAA, from earlier post ]
Sunspots

The upcoming El Niño looks set to coincide with a high number of sunspots. The number of sunspots is forecast to reach a peak in July 2025 and recent numbers are higher than expected, as illustrated by the image on the right, from NOAA.


An analysis in an earlier post concludes that the rise in sunspots from May 2020 to July 2025 could make a difference of some 0.15°C. Recent numbers of sunspots have been high. This confirms the study mentioned in the earlier post that warns that the peak of this cycle could rival the top few since records began, which would further increase the difference.


Joint impact of El Niño and sunspots

In conclusion, the joint impact of a strong El Niño and high sunspots could make a difference of more than 0.65°C. This rise could trigger further developments and feedbacks that altogether could cause a temperature to rise from pre-industrial of as much as 18.44°C by 2026.

Further developments and feedbacks

A combination of further developments and feedbacks could cause a huge temperature rise. 
An example of this is the decline of the cryosphere, i.e. the global snow and ice cover.
Antarctic sea ice extent is currently at a record low for the time of year, as illustrated by the image on the right. Antarctic sea ice extent reached a record low on February 25, 2022, and Antarctic sea ice extent looks set to get even lower this year. 
Global sea ice extent is also at a record low for the time of year, as illustrated by the image below, which shows that global sea ice extent was 4.6 million km² on January 2, 2023. 

The image below is from tropicaltidbits.com and shows a forecast for September 2023 of the 2-meter temperature anomaly in degrees Celsius and based on 1984-2009 model climatology. The anomalies are forecast to be very high for the Arctic Ocean, as well as for the Southern Ocean around Antarctica, which spells bad news for sea ice at both hemispheres. 
Loss of sea ice results in loss of albedo and loss of the latent heat buffer that – when present – consumes ocean heat as the sea ice melts. These combined losses could result in a large additional temperature rise, while there are further contributors to the temperature rise, such as thawing of terrestrial permafrost and associated changes such as deformation of the Jet Stream and additional ocean heat moving into the Arctic from the Atlantic Ocean and the Pacific Ocean.

There are many further developments and feedbacks that could additionally speed up the temperature rise, such as the (currently accelerating) rise of greenhouse gas emissions, falling away of the aerosol masking effect, more biomass being burned for energy and an increase in forest and waste fires. 

As said, these developments and feedbacks could jointly cause a temperature rise from pre-industrial of as much as 18.44°C by 2026, as discussed at the Extinction page. Keep in mind that humans are likely to go extinct with a rise of 3°C, as illustrated by the image below, from an analysis discussed in an earlier post.

The situation is dire and threatens to turn catastrophic soon. The right thing to do now is to help avoid or delay the worst from happening, through action as described in the Climate Plan.

Links

• NASA – La Niña Times Three

• NOAA Climate Prediction Center – ENSO: Recent Evolution, Current Status and Predictions

• Sunspots

https://arctic-news.blogspot.com/p/sunspots.html

• Cataclysmic Alignment
https://arctic-news.blogspot.com/2022/06/cataclysmic-alignment.html

• NOAA National Centers for Environmental Information, State of the Climate: Monthly Global Climate Report for October 2022, retrieved November 16, 2022
https://www.ncei.noaa.gov/access/monitoring/monthly-report/global/2022010/supplemental/page-4

• Tropicaltidbits.comhttps://www.tropicaltidbits.com

• Jet Stream

• Cold freshwater lid on North Atlantic

Antarctic sea ice in rapid decline

By |2022-12-16T05:34:19+00:00December 16th, 2022|

Earlier this year, on February 25, Antarctic sea ice extent was at an all-time record low of 1.924 million km², as the above image shows. Throughout the year, Antarctic sea ice extent has been low. On December 14, 2022, Antarctic sea ice was merely 9.864 million km² in extent. Only in 2016 was Antarctic sea ice extent lower at that time of year, and – importantly – 2016 was a strong El Niño year.

The NOAA image on the right indicates that, while we’re still in the depths of a persistent La Niña, the next El Niño looks set to strike soon.

Meanwhile, ocean heat content keeps rising due to high levels of greenhouse gases, as illustrated by the image on the right. 

Rising ocean heat causes sea ice to melt from below, resulting in less sea ice, which in turn means that less sunlight gets reflected back into space and more sunlight gets absorbed as heat in the ocean, making it a self-reinforcing feedback loop that further speeds up sea ice loss. 

The currently very rapid decline in sea ice concentration around Antarctica is illustrated by the animation of Climate Reanalyzer images on the right, showing Antarctic sea ice on November 16, November 29 and December 15, 2022.

In 2012, a research team led by Jemma Wadham studied Antarctica, concluding that an amount of 21,000 Gt or billion tonnes or petagram (1Pg equals 10¹⁵g) of organic carbon is buried beneath the Antarctic Ice Sheet, as discussed in an earlier post

The potential amount of methane hydrate and free methane gas beneath the Antarctic Ice Sheet could be up to 400 billion tonnes. 
The predicted shallow depth of these potential reserves also makes them more susceptible to climate forcing than other methane hydrate reserves on Earth, describes the news release.

“We are sleepwalking into a catastrophe for humanity. We need to take notice right now. It is already happening. This is not a wait-and-see situation anymore,” Jemma Wadham said more recently.

Ominously, high concentrations of methane have been recorded over Antarctica recently. The image below shows methane as recorded by the Metop-B satellite on November 28, 2022 pm at 399 mb. 

The situation is dire and the right thing to do now is to help avoid or delay the worst from happening, through action as described in the Climate Plan.

Links

• NSIDC – Interactive sea ice graph
https://nsidc.org/arcticseaicenews/charctic-interactive-sea-ice-graph

• NOAA – ENSO: Recent Evolution, Current Status and Predictions
https://www.cpc.ncep.noaa.gov/products/analysis_monitoring/lanina/enso_evolution-status-fcsts-web.pdf

• NOAA – ocean heat content
https://www.ncei.noaa.gov/access/global-ocean-heat-content/index.html

• Climate Reanalyzer sea ice concentration
https://climatereanalyzer.org/wx/todays-weather/?var_id=seaice-snowc&ortho=7&wt=1

• Potential methane reservoirs beneath Antarctica – Press release University of Bristol (2012)
https://www.bristol.ac.uk/news/2012/8742.html

• Potential methane reservoirs beneath Antarctica – by Jemma Wadham et al. (2012)
https://www.nature.com/articles/nature11374

• A new frontier in climate change science: connections between ice sheets, carbon and food webs

• Metop-B satellite readings

• Climate Plan
https://arctic-news.blogspot.com/p/climateplan.html

Arctic Ocean overheating

By |2022-12-05T10:37:38+00:00December 5th, 2022|

Arctic sea ice extent was 10.31 million km² on December 4, 2022. At this time of year, extent was smaller only in two years, i.e. in 2016 and 2020, both strong El Niño years. With the next El Niño, Arctic sea ice extent looks set to reach record lows. 

The NOAA image on the right indicates that, while we’re still in the depths of a persistent La Niña, the next El Niño looks set to strike soon.

The image below shows high sea surface temperature anomalies near the Bering Strait on December 2, 2022, with a “hot blob” in the North Pacific Ocean where sea surface temperature anomalies are reaching as high as 7°C or 12.6°F from 1981-2011. The Jet Stream is stretched out vertically from pole to pole, enabling hot air to enter the Arctic from the Pacific Ocean and from the Atlantic Ocean.

The image below shows a forecast for December 5, 2022, of 2m temperature anomalies versus 1979-2000, with anomalies over the Arctic Ocean near the top end of the scale.

The situation is dire and the right thing to do now is to help avoid or delay the worst from happening, through action as described in the Climate Plan.

Links

• Vishop sea ice extent
https://ads.nipr.ac.jp/vishop/#/extent

• NOAA ENSO: Recent Evolution, Current Status and Predictions
https://www.cpc.ncep.noaa.gov/products/analysis_monitoring/lanina/enso_evolution-status-fcsts-web.pdf

• nullschool.net
https://earth.nullschool.net

• Climate Reanalyzizer
https://www.tropicaltidbits.com

• Climate Plan
https://arctic-news.blogspot.com/p/climateplan.html