temperature

Should Thames Water be allowed to fail ?

By |2025-01-02T17:00:14+00:00December 31st, 2024|

Thames Water, the UK’s largest water provider with nearly 16 million users, is currently facing serious financial issues. Should it be allowed to fall into administration?

As of December 2024, the company’s debt exceeded £19 billion, raising questions about its operational viability and the likelihood for government intervention.

It recorded an operational deficit of £189 million in the first half of 2024, attributable to pollution penalties, consultancy payouts, and losses on inter-company loans. The corporation also faced exceptional charges of £465 million, including a £104 million provision for anticipated fines and a £40 million restructuring program.

This significant debt burden has stretched its financial resources, limiting its capacity to invest in critical infrastructure projects. Thomas Water has stated that it may run out of money by March 2025.

A 40% increase in pollution events has resulted in substantial fines, severely stressing the company’s budget. Thames Water was fined £18.2 million by Ofwat in December 2024 for violating dividend regulations on payments made in 2023 and 2024. Ofwat also stated that it will “claw back value” to recover £131 million of the payments.

Should Thames Water be allowed to fail ?

Thames Water is currently seeking permission for a potential £3 billion financial rescue package to address its current financial challenges – but will a new bail-out be merely “kicking the can down the road” ?

As an alternative, going into administration would support a full restructuring of the company’s operations, allowing a greater focus on efficiency and service quality without the immediate strain of debt commitments. This procedure then gets an opportunity to fix the root causes that have hampered the company’s performance over years of managed decline.

Administration allows the opportunity to reorganise or reduce the company’s significant debt, relieving financial pressures and creating a more sustainable economic model, thus increasing the company’s capacity to invest in vital infrastructure and environmental initiative.

A government-appointed administrator would verify that the company’s activities are in the public’s best interests, potentially leading to increased environmental compliance and customer service standards. This oversight has the potential to rebuild public trust while also ensuring regulatory compliance.

The administration of such a large utility may encourage a rethinking of the regulatory and ownership arrangements in the UK’s water industry, potentially leading to broader reforms that benefit both consumers and the environment. This may involve talks on alternative ownership arrangements, such as mutual or cooperative structures.

What are the potential downsides and risks ?

Going into administration, it will be critical to provide service continuity throughout: uninterrupted water supply and wastewater services during the transition period to preserve public health and safety.

The restructuring process will cause job uncertainty for Thames Water’s personnel, needing appropriate communication and support measures to address employee concerns.

To the financial markets, allowing a large utility to fall into administration might have a broader impact on investor confidence in the UK’s regulated industries, potentially influencing future investment and financing in the sector. 

It will be critical to strike a compromise between Thames Water’s immediate requirements and the industry’s overall stability but the question remains: why shouldn’t Thames Water be allowed to fail and give us an opportunity to reset and renew, as a template for the UK water industry going forward, utilising a new mutual or cooperative model ?

The global climate change suicide pact

By |2025-01-09T09:36:35+00:00January 29th, 2023|

 by Andrew Glikson

Despite of deceptively-claimed mitigation of greenhouse gas (GHG) emissions in parts of the world, ongoing burning of domestic and exported fossil fuels world-wide continues to change the composition of the atmosphere, enriching it in greenhouse gases by yet another ~2 ppm CO₂ (2022: 418.95 ppm; CH₄: 1915 ppb; N₂0: 337 ppb), reaching levels commensurate with those of the Miocene (23.03 to 5.333 Ma) at rise rates exceeding any in the geological record of the last 66 million years (Glikson, 2020) (Figure 1).

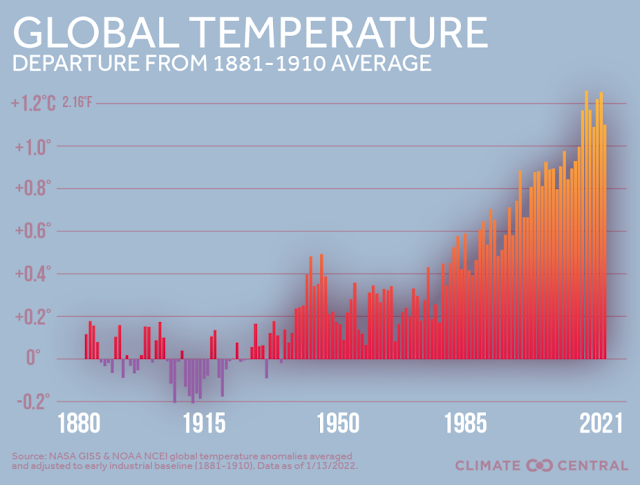
Figure 1. Global 1880-2021 annual average temperatures (adapted by UCAR from ClimateCentral).

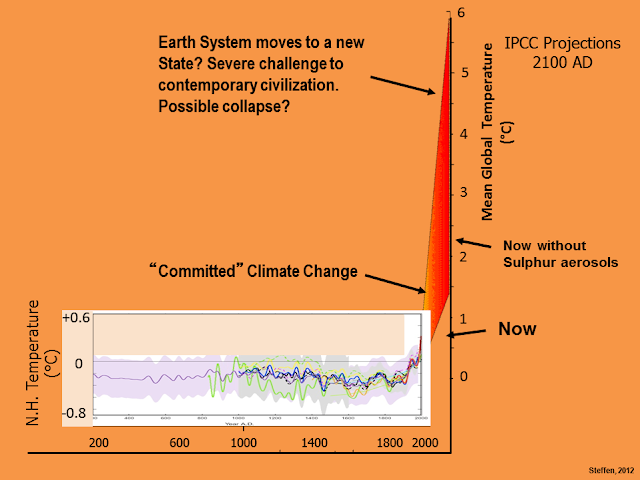
Since 1880 mean global temperatures rose at a rate of 0.08°C per decade, from 1981 by 0.18°C per decade and more when emitted aerosols are accounted for (Hansen et al., in Berwyn, 2022). According to Will Steffen, Australia’s leading climate scientist “there was already a chance we have triggered a global tipping cascade that would take us to a less habitable Hothouse Earth climate, regardless of whether we reduced emissions” (Figure 2).

Figure 2. Global mean temperature profile since 200 AD projected to beyond 2000 AD (Will Steffen)

Over a brief span of less than two centuries (Figure 1) anthropogenic reversal of the carbon cycle induced the emission of some 1.5 10¹² tonnes of CO₂ and an increased release of 150% more CH₄ from the crust, accumulated in sediments for hundreds of million years through photosynthesis and calcification, as well as from permafrost and oceans. Permeation of the atmosphere and the hydrosphere with the toxic residues of ancient plants and organisms, poisoning the biosphere, is leading to the Sixth mass extinction of species in the history of nature.

Following failed attempts to deny climate science, vested business and political interests are proceeding, with the support of many governments, to mine coal, sink oil wells and frack hydrocarbon gas, regardless of the consequences in term of global heating, sea level rise, inundation of islands and coastal zones, collapse of the permafrost, heat waves, floods, ocean acidification, migration of climate zones and dissemination of plastic particles, rendering the future of much of the biosphere uninhabitable.

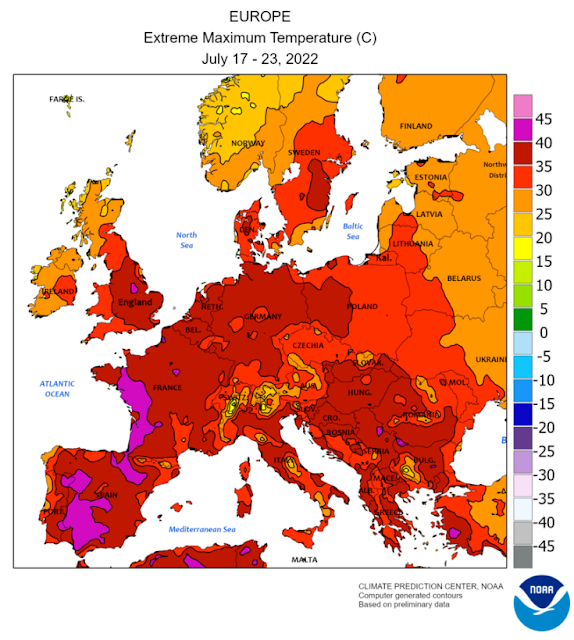
Figure 3. Europe: Maximum extreme temperatures, July 17-23, 2002.

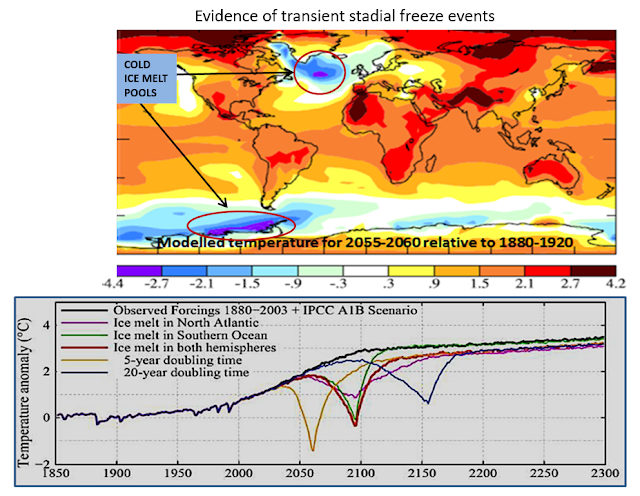
The progression of global warming is unlikely to be linear as the flow of cold ice melt water from Greenland and Antarctica glaciers would cool parts of the ocean and in part the continents (Figure 4), leading toward a stadial-type phenomenon, the classic case of which is symbolized by the Younger dryas cool period 12,900 to 11,700 years ago.

Figure 4. Projected transient stadial cooling events (Hansen et al., 2016)

National and international legal systems appear unable to restrict the saturation of the atmosphere with greenhouse gases, as governments preside over the worst calamity in natural history since the demise of the dinosaurs. Facing heatwaves (Figure 3), fires, floods and sea level rise, those responsible may in part remain oblivious to the magnitude of the consequences, waking up when it is too late.

There was a time when leaders fell on their sword when defeated in battle or lose their core beliefs, nowadays most not even resign their privileged positions to resist the existential danger posed to advanced life, including human civilization, preoccupied as nations are with preparations for nuclear wars.

It is long past time to declare a global climate and nuclear emergency.
Andrew Glikson

A/Prof. Andrew Glikson

Earth and Paleo-climate scientist
School of Biological, Earth and Environmental Sciences
The University of New South Wales,
Kensington NSW 2052 Australia

Books:
The Asteroid Impact Connection of Planetary Evolution
https://www.springer.com/gp/book/9789400763272
The Archaean: Geological and Geochemical Windows into the Early Earth
https://www.springer.com/gp/book/9783319079073
Climate, Fire and Human Evolution: The Deep Time Dimensions of the Anthropocene
https://www.springer.com/gp/book/9783319225111
The Plutocene: Blueprints for a Post-Anthropocene Greenhouse Earth
https://www.springer.com/gp/book/9783319572369
Evolution of the Atmosphere, Fire and the Anthropocene Climate Event Horizon
https://www.springer.com/gp/book/9789400773318
From Stars to Brains: Milestones in the Planetary Evolution of Life and Intelligence
https://www.springer.com/us/book/9783030106027
Asteroids Impacts, Crustal Evolution and Related Mineral Systems with Special Reference to Australia
https://www.springer.com/us/book/9783319745442
The Event Horizon: Homo Prometheus and the Climate Catastrophe
https://www.springer.com/gp/book/9783030547332
The Fatal Species: From Warlike Primates to Planetary Mass Extinction
https://www.springer.com/gp/book/9783030754679

Wild Winter Weather

By |2025-01-09T09:37:41+00:00December 23rd, 2022|

[ posted earlier at facebook ]

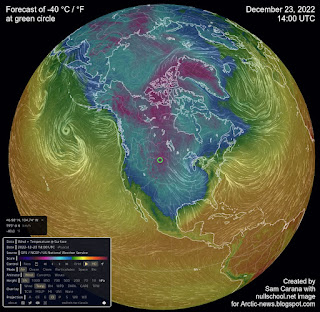
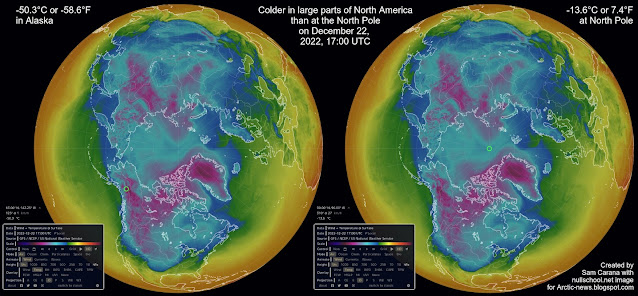
The image on the right shows a forecast of very low temperatures over North America with a temperature of -40 °C / °F highlighted (green circle at center) for December 23, 2022 14:00 UTC.

As the image shows, temperatures over large parts of North America are forecast to be even lower than the temperature at the North Pole.
The combination image below illustrates this further, showing temperatures as low as -50.3°C or -58.6°F in Alaska on December 22, 2022 at 17:00 UTC, while at the same time the temperature at the North Pole was -13.6°C or 7.4°F.
The Jet Stream
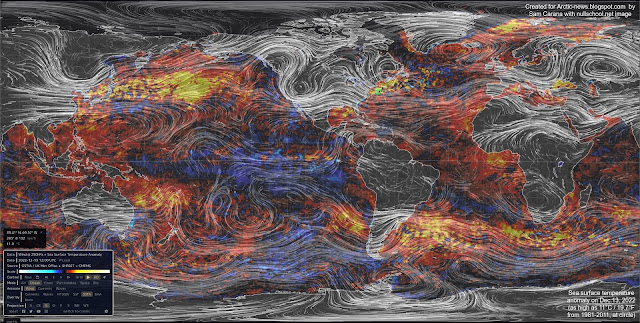
The image below shows the Jet Stream (250 hPa) on December 13, 2022, stretched out vertically and reaching the North Pole as well as the South Pole, while sea surface temperature anomalies are as high as 11°C or 19.7°F from 1981-2011 at the green circle.
The Jet Stream used to circumnavigate the globe within a narrow band from West to East (due to the Coriolis Force), and it used to travel at relatively high speed, fuelled by the temperature difference between the tropics and the poles.
[ posted earlier at facebook ]
As the above image shows, the Pacific Ocean is currently cooler at the tropics and warmer further to the north (compared to 1981-2011), which narrows this temperature difference and in turn makes the Jet Stream wavier. Accordingly, the Jet Stream is going up high into the Arctic before descending deep down over North America.
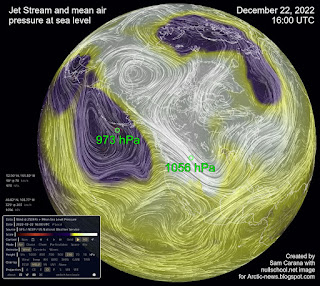
The image on the right shows air pressure at sea level on December 22, 2022. High sea surface temperatures make air rise, lowering air pressure at the surface to levels as low as 973 hPa over the Pacific. Conversely, a more wavy Jet Stream enables cooler air to flow from the Arctic to North America, raising air pressure at the surface to levels as high as 1056 hPa.
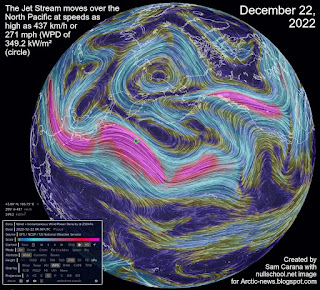
On December 22, 2022, the Jet Stream reached very high speeds over the Pacific, fuelled by high sea surface temperature anomalies. The image on the right shows the Jet Stream moving over the North Pacific at speeds as high as 437 km/h or 271 mph (with a Wind Power Density of 349.2 kW/m², at the green circle).
The Jet Stream then collides with higher air pressure and moves up into the Arctic, and subsequently descends deep down over North America, carrying along cold air from the Arctic. Distortion of the Jet Stream also results in the formation of circular wind patterns that further accelerate the speed of the Jet Stream.
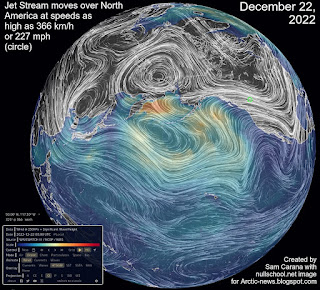
The image on the right shows the Jet Stream moving over North America at speeds as high as 366 km/h or 227 mph (green circle). The image also shows high waves in the North Pacific.
La Niña / El Niño
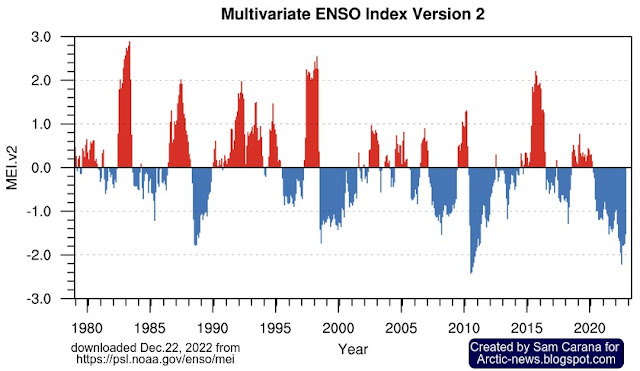
The low sea surface temperature anomalies in the Pacific Ocean are in line with the current La Niña.
The fact that such extreme weather events occur while we’re in the depth of a persistent La Niña is worrying. The next El Niño could push up temperatures further, which would hit the Arctic most strongly. This would further narrow the difference between temperatures at the Equator and the North Pole, thus making the Jet Stream more wavy, which also enables warm air to move into the Arctic, further accelerating feedbacks in the Arctic.
The image below, from NOAA, indicates that the next El Niño is likely to emerge soon.

Conclusion

The situation is dire and calls for immediate, comprehensive and effective action as described in the Climate Plan.

Links

• nullschool
• Jet Stream
• Coriolis Force
• Wind Power Density

• Extreme Weather
https://arctic-news.blogspot.com/p/extreme-weather.html

• Feedbacks in the Arctic
https://arctic-news.blogspot.com/p/feedbacks.html

• NOAA – Multivariate ENSO Index Version 2 (MEI.v2)

Politicians for sale

By |2025-01-09T12:00:50+00:00December 12th, 2022|

Are politicians for sale?

How can it be measured whether politicians are for sale and to what extent this occurs?

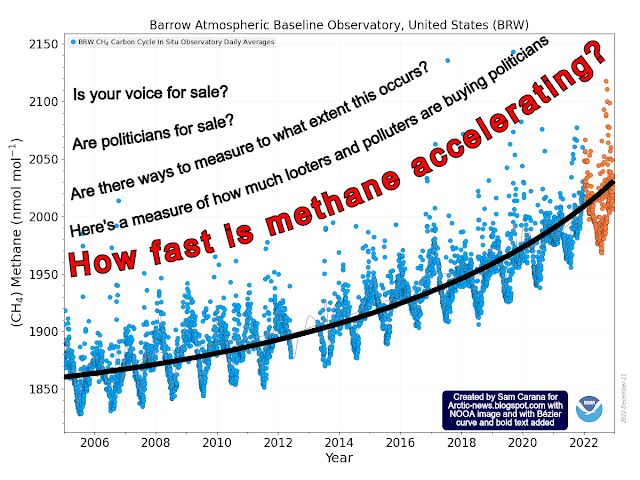
One measure of how much looters and polluters are buying politicians could be this: How fast is methane accelerating?

Rise in methane and rise in temperature
The rise in methane is vitally important, given methane’s potential to rapidly push up temperatures.

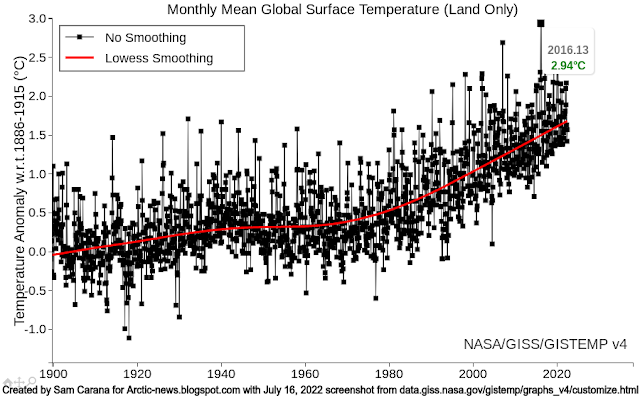
Arguably the most important metric related to climate change is surface temperature on land, as illustrated by the image below from an earlier post. The image was created with a July 16, 2022 screenshot from NASA customized analysis plots and shows that the February 2016 (land only) anomaly from 1886-1915 was 2.94°C or 5.292°F.

Extinction

Land-only anomalies are important. After all, most people live on land, where temperatures are rising even faster than they are rising globally, and humans will likely go extinct with a rise of 3°C above pre-industrial, as illustrated by the image below, from an analysis in earlier post.

Note that in the above plot, anomalies are measured versus 1886-1915, which isn’t pre-industrial. The image raises questions as to what the temperature rise would look like when using a much earlier base, and how much temperatures could rise over the next few years.

What can be done about it?

The next question is: What can be done about it? To avoid politicians getting bought by looters and polluters, action on climate change is best implemented locally, with Local People’s Courts ensuring that implementation is science-based.

Conclusions
The situation is dire and the right thing to do now is to help avoid or delay the worst from happening, through action as described in the Climate Plan and posts at Arctic-news.blogspot.com
Links
• Human Extinction by 2025?
• NASA customized analysis plots

• When will we die?
https://arctic-news.blogspot.com/2019/06/when-will-we-die.html

• Pre-industrial

Go to Top