Wild Winter Weather
 |
| [ posted earlier at facebook ] |
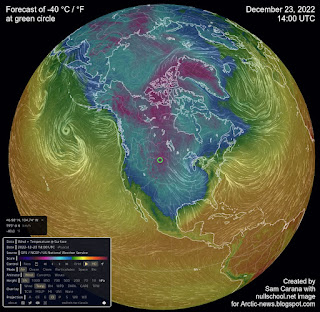
The image on the right shows a forecast of very low temperatures over North America with a temperature of -40 °C / °F highlighted (green circle at center) for December 23, 2022 14:00 UTC.
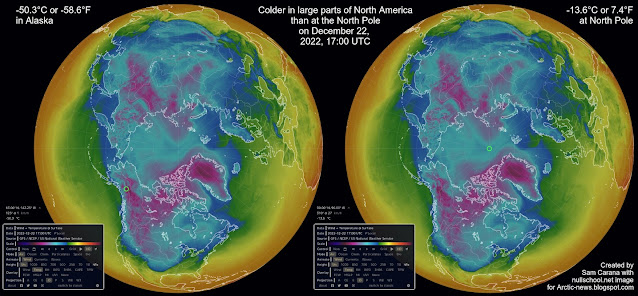
As the image shows, temperatures over large parts of North America are forecast to be even lower than the temperature at the North Pole.
The combination image below illustrates this further, showing temperatures as low as -50.3°C or -58.6°F in Alaska on December 22, 2022 at 17:00 UTC, while at the same time the temperature at the North Pole was -13.6°C or 7.4°F.
The Jet Stream
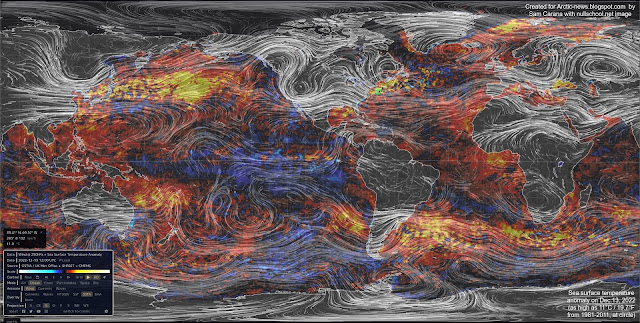
The image below shows the Jet Stream (250 hPa) on December 13, 2022, stretched out vertically and reaching the North Pole as well as the South Pole, while sea surface temperature anomalies are as high as 11°C or 19.7°F from 1981-2011 at the green circle.
The Jet Stream used to circumnavigate the globe within a narrow band from West to East (due to the Coriolis Force), and it used to travel at relatively high speed, fuelled by the temperature difference between the tropics and the poles.
 |
| [ posted earlier at facebook ] |
As the above image shows, the Pacific Ocean is currently cooler at the tropics and warmer further to the north (compared to 1981-2011), which narrows this temperature difference and in turn makes the Jet Stream wavier. Accordingly, the Jet Stream is going up high into the Arctic before descending deep down over North America.
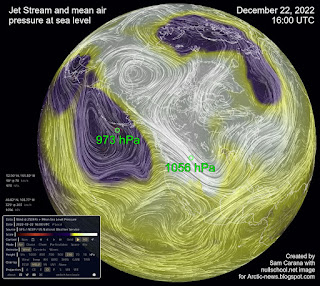
The image on the right shows air pressure at sea level on December 22, 2022. High sea surface temperatures make air rise, lowering air pressure at the surface to levels as low as 973 hPa over the Pacific. Conversely, a more wavy Jet Stream enables cooler air to flow from the Arctic to North America, raising air pressure at the surface to levels as high as 1056 hPa.
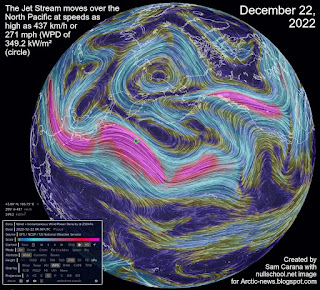
On December 22, 2022, the Jet Stream reached very high speeds over the Pacific, fuelled by high sea surface temperature anomalies. The image on the right shows the Jet Stream moving over the North Pacific at speeds as high as 437 km/h or 271 mph (with a Wind Power Density of 349.2 kW/m², at the green circle).
The Jet Stream then collides with higher air pressure and moves up into the Arctic, and subsequently descends deep down over North America, carrying along cold air from the Arctic. Distortion of the Jet Stream also results in the formation of circular wind patterns that further accelerate the speed of the Jet Stream.
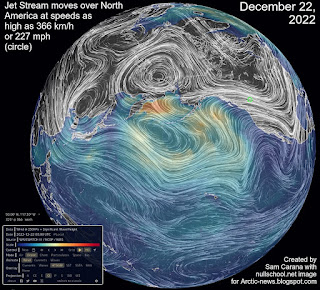
The image on the right shows the Jet Stream moving over North America at speeds as high as 366 km/h or 227 mph (green circle). The image also shows high waves in the North Pacific.
La Niña / El Niño
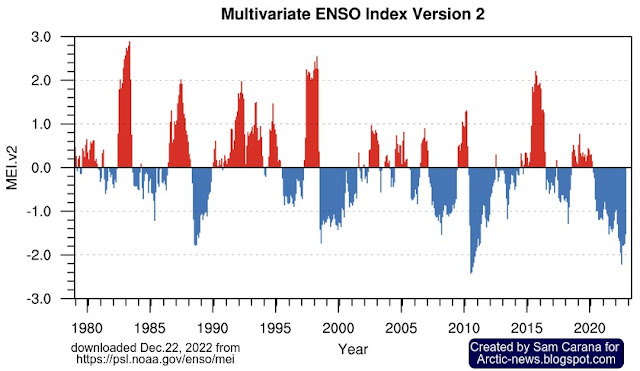
The low sea surface temperature anomalies in the Pacific Ocean are in line with the current La Niña.
The fact that such extreme weather events occur while we’re in the depth of a persistent La Niña is worrying. The next El Niño could push up temperatures further, which would hit the Arctic most strongly. This would further narrow the difference between temperatures at the Equator and the North Pole, thus making the Jet Stream more wavy, which also enables warm air to move into the Arctic, further accelerating feedbacks in the Arctic.
The image below, from NOAA, indicates that the next El Niño is likely to emerge soon.
Conclusion
The situation is dire and calls for immediate, comprehensive and effective action as described in the Climate Plan.
Links
• nullschool
• Jet Stream
• Coriolis Force
• Wind Power Density
• Extreme Weather
https://arctic-news.blogspot.com/p/extreme-weather.html
• Feedbacks in the Arctic
https://arctic-news.blogspot.com/p/feedbacks.html
• NOAA – Multivariate ENSO Index Version 2 (MEI.v2)
• Climate Plan
https://arctic-news.blogspot.com/p/climateplan.html
https://arctic-news.blogspot.com/p/climateplan.html

