Dire situation gets even more dire
Sea ice extent is very low at both poles at the moment, and the outlook is that the situation is getting even worse.
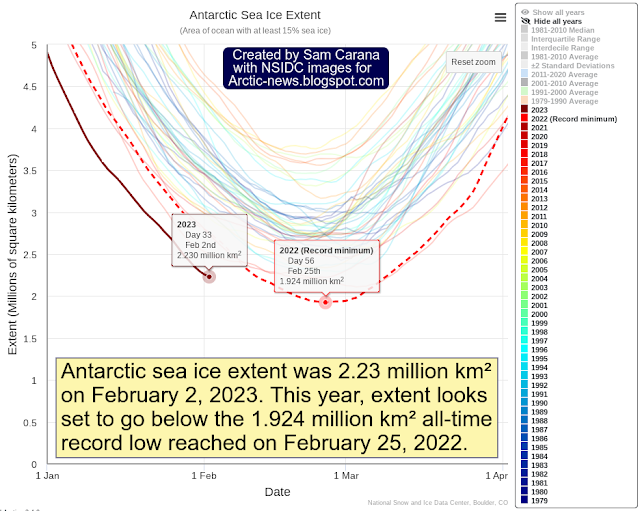
Around Antarctica, sea ice extent was 2.23 million km² on February 2, 2023. Later in February this year, extent looks set to go below the 1.924 million km² all-time record low reached on February 25, 2022.
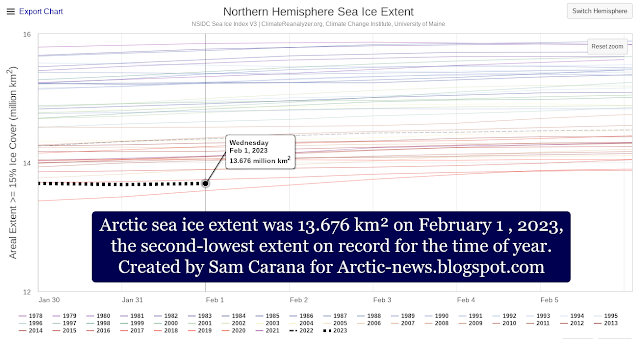
Arctic sea ice extent was 13.676 km² on February 1 , 2023, the second-lowest extent on record for the time of year, as illustrated by the image below.
As the above image indicates, over the next few days Arctic sea ice extent looks set to reach an all-time record low for the time of year.
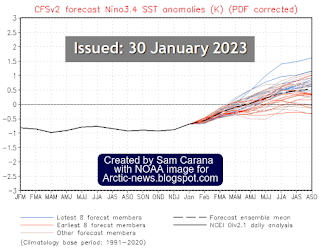
It looks like it’s going to be a very strong El Niño, given that we’ve been in a La Niña for such a long time.
 |
| [ from earlier post, adapted from NOAA ] |
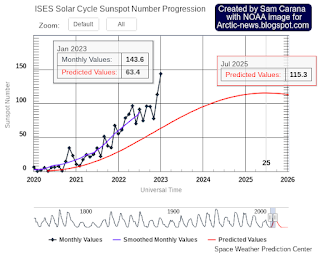
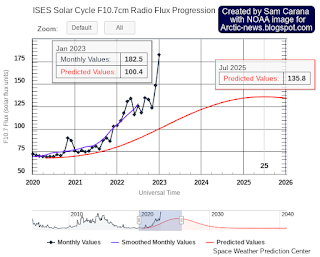
Observed values for January 2023 are already well above the maximum values that NOAA predicted to be reached in July 2025. If this trend continues, the rise in sunspots forcing from May 2020 to July 2025 may well make a difference of more than 0.25°C, a recent analysis found.
Further feedbacks include additional greenhouse gas release such as methane from the seafloor of the Arctic Ocean and methane, carbon dioxide and nitrous oxide from rapidly thawing permafrost on land.
Falling away of this aerosol masking effect could cause a huge temperature rise, while there could be an additional temperature rise due to an increase in warming aerosols and gases as a result of more biomass and waste burning and forest fires.
Links
• NSIDC – Chartic interactive sea ice graph
https://nsidc.org/arcticseaicenews/charctic-interactive-sea-ice-graph
• Climate Reanalyzer – sea ice based on NSIDC index V3
https://climatereanalyzer.org/clim/seaice
• Extinction
https://arctic-news.blogspot.com/p/extinction.html
• Pre-industrial
• NOAA – Climate Prediction Center – ENSO: Recent Evolution, Current Status and Predictions
https://www.cpc.ncep.noaa.gov/products/analysis_monitoring/lanina/enso_evolution-status-fcsts-web.pdf
• NOAA – Monthly temperature anomalies versus El Niño
https://www.ncei.noaa.gov/access/monitoring/monthly-report/global/202213/supplemental/page-2
• Tonga eruption increases chance of temporary surface temperature anomaly above 1.5 °C – by Stuart Jenkins et al.
https://www.nature.com/articles/s41558-022-01568-2
• The Clouds Feedback and the Clouds Tipping Point
https://arctic-news.blogspot.com/p/clouds-feedback.html
https://arctic-news.blogspot.com/p/climateplan.html

