Antarctica

Dire situation gets even more dire

By |2023-02-04T07:39:16+00:00February 4th, 2023|

Sea ice extent is very low at both poles at the moment, and the outlook is that the situation is getting even worse.

Around Antarctica, sea ice extent was 2.23 million km² on February 2, 2023. Later in February this year, extent looks set to go below the 1.924 million km² all-time record low reached on February 25, 2022.

Arctic sea ice extent was 13.676 km² on February 1 , 2023, the second-lowest extent on record for the time of year, as illustrated by the image below.

As the above image indicates, over the next few days Arctic sea ice extent looks set to reach an all-time record low for the time of year.

Conditions are dire
This means that Antarctic sea ice could reach an all-time record low extent later this month, while at the same time Arctic sea ice could be at a record low extent for the time of year.
Furthermore, emissions keep rising, ocean heat and greenhouse gas levels keep rising and extreme weather events are getting ever more extreme. Keep in mind that carbon dioxide reaches its maximum warming some 10 years after emission, so we haven’t yet been hit by the full wrath of carbon dixode pollution.  
Furthermore, an earlier analysis concludes that we have already exceeded the 2°C threshold set at the Paris Agreement in 2015. 
These dire conditions spell bad news regarding the temperature rise over the coming years. On top of these dire conditions, there are a number of circumstances, feedbacks and further developments that make the outlook even more dire.
Circumstances that make the situation even more dire

Firstly, as illustrated by the image on the right, adapted from NOAA, we’re moving into an El Niño.

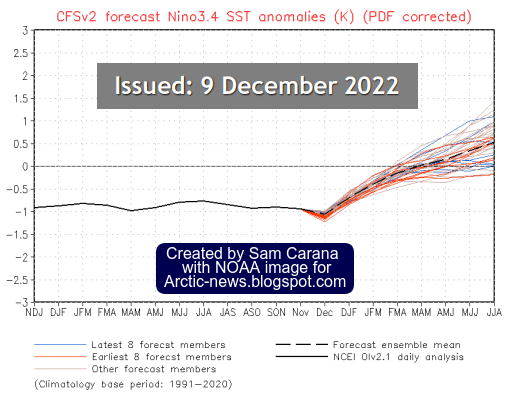
It looks like it’s going to be a very strong El Niño, given that we’ve been in a La Niña for such a long time. 

Moving from the bottom of a La Niña to the peak of a strong El Niño could make a difference of more than half a degree Celsius, as illustrated by the image below.
[ from earlier post, adapted from NOAA ]
Secondly, sunspots look set to reach a very high maximum by July 2025, as illustrated by the next two images on the right, adapted from NOAA.

Observed values for January 2023 are already well above the maximum values that NOAA predicted to be reached in July 2025. If this trend continues, the rise in sunspots forcing from May 2020 to July 2025 may well make a difference of more than 0.25°C, a recent analysis found.

Thirdly, the 2022 Tonga submarine volcano eruption did add a huge amount of water vapor to the atmosphere. 
Since water vapor is a potent greenhouse gas, this is further contributing to speed up the temperature rise. 
2023 study calculates that the submarine volcano eruption near Tonga in January 2022, as also discussed at facebook, will have a warming effect of 0.12 Watts/m² over the next few years.
Feedbacks and developments making things worse
Then, there are a multitude of feedbacks and further developments that could strongly deteriorate the situation even further.
On top of the water vapor added by the Tonga eruption, there are several feedbacks causing more water vapor to get added to the atmosphere, as discussed at Moistening Atmosphere.  

Further feedbacks include additional greenhouse gas release such as methane from the seafloor of the Arctic Ocean and methane, carbon dioxide and nitrous oxide from rapidly thawing permafrost on land.

Some developments could make things even worse. As discussed in earlier posts such as this one and this one, the upcoming temperature rise on land on the Northern Hemisphere could be so high that it will cause much traffic, transport and industrial activity to grind to a halt, resulting in a reduction in cooling aerosols that are currently masking the full wrath of global warming.

Falling away of this aerosol masking effect could cause a huge temperature rise, while there could be an additional temperature rise due to an increase in warming aerosols and gases as a result of more biomass and waste burning and forest fires.

A huge temperature rise could therefore unfold soon, causing the clouds tipping point to be crossed that on its own could result in further rise of 8°C. Meanwhile, humans are likely to go extinct with a rise of 3°C, as illustrated by the image below, from an analysis discussed in an earlier post.


Conclusion
The dire situation we’re in looks set to get even more dire, calling for comprehensive and effective action, as described in the Climate Plan.

Links

• NSIDC – Chartic interactive sea ice graph
https://nsidc.org/arcticseaicenews/charctic-interactive-sea-ice-graph

• Climate Reanalyzer – sea ice based on NSIDC index V3
https://climatereanalyzer.org/clim/seaice
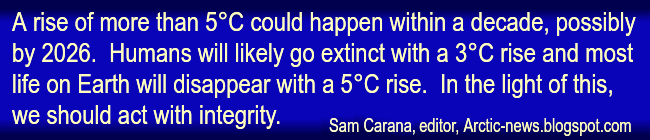
• Extinction
https://arctic-news.blogspot.com/p/extinction.html

• Pre-industrial

• NOAA – Solar cycle progression
• Sunspots
https://arctic-news.blogspot.com/p/sunspots.html

• Tonga eruption increases chance of temporary surface temperature anomaly above 1.5 °C – by Stuart Jenkins et al.
https://www.nature.com/articles/s41558-022-01568-2

• Moistening Atmosphere
• Methane keeps rising
• A huge temperature rise threatens to unfold soon

• The Clouds Feedback and the Clouds Tipping Point
https://arctic-news.blogspot.com/p/clouds-feedback.html

Antarctic sea ice in rapid decline

By |2022-12-16T05:34:19+00:00December 16th, 2022|

Earlier this year, on February 25, Antarctic sea ice extent was at an all-time record low of 1.924 million km², as the above image shows. Throughout the year, Antarctic sea ice extent has been low. On December 14, 2022, Antarctic sea ice was merely 9.864 million km² in extent. Only in 2016 was Antarctic sea ice extent lower at that time of year, and – importantly – 2016 was a strong El Niño year.

The NOAA image on the right indicates that, while we’re still in the depths of a persistent La Niña, the next El Niño looks set to strike soon.

Meanwhile, ocean heat content keeps rising due to high levels of greenhouse gases, as illustrated by the image on the right. 

Rising ocean heat causes sea ice to melt from below, resulting in less sea ice, which in turn means that less sunlight gets reflected back into space and more sunlight gets absorbed as heat in the ocean, making it a self-reinforcing feedback loop that further speeds up sea ice loss. 

The currently very rapid decline in sea ice concentration around Antarctica is illustrated by the animation of Climate Reanalyzer images on the right, showing Antarctic sea ice on November 16, November 29 and December 15, 2022.

In 2012, a research team led by Jemma Wadham studied Antarctica, concluding that an amount of 21,000 Gt or billion tonnes or petagram (1Pg equals 10¹⁵g) of organic carbon is buried beneath the Antarctic Ice Sheet, as discussed in an earlier post

The potential amount of methane hydrate and free methane gas beneath the Antarctic Ice Sheet could be up to 400 billion tonnes. 
The predicted shallow depth of these potential reserves also makes them more susceptible to climate forcing than other methane hydrate reserves on Earth, describes the news release.

“We are sleepwalking into a catastrophe for humanity. We need to take notice right now. It is already happening. This is not a wait-and-see situation anymore,” Jemma Wadham said more recently.

Ominously, high concentrations of methane have been recorded over Antarctica recently. The image below shows methane as recorded by the Metop-B satellite on November 28, 2022 pm at 399 mb. 

The situation is dire and the right thing to do now is to help avoid or delay the worst from happening, through action as described in the Climate Plan.

Links

• NSIDC – Interactive sea ice graph
https://nsidc.org/arcticseaicenews/charctic-interactive-sea-ice-graph

• NOAA – ENSO: Recent Evolution, Current Status and Predictions
https://www.cpc.ncep.noaa.gov/products/analysis_monitoring/lanina/enso_evolution-status-fcsts-web.pdf

• NOAA – ocean heat content
https://www.ncei.noaa.gov/access/global-ocean-heat-content/index.html

• Climate Reanalyzer sea ice concentration
https://climatereanalyzer.org/wx/todays-weather/?var_id=seaice-snowc&ortho=7&wt=1

• Potential methane reservoirs beneath Antarctica – Press release University of Bristol (2012)
https://www.bristol.ac.uk/news/2012/8742.html

• Potential methane reservoirs beneath Antarctica – by Jemma Wadham et al. (2012)
https://www.nature.com/articles/nature11374

• A new frontier in climate change science: connections between ice sheets, carbon and food webs

• Metop-B satellite readings

• Climate Plan
https://arctic-news.blogspot.com/p/climateplan.html