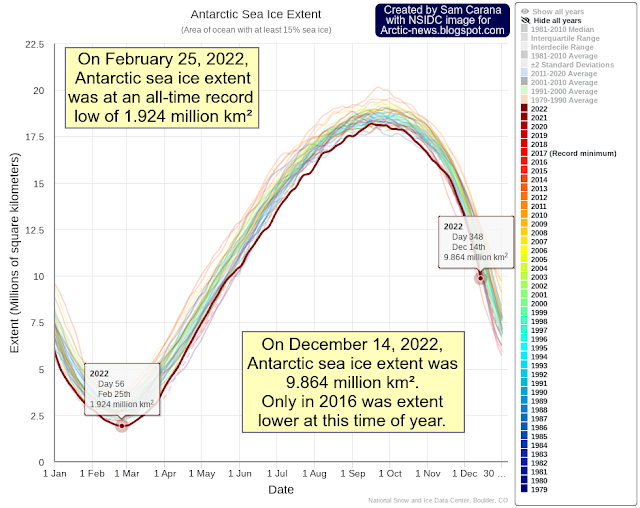
Earlier this year, on February 25, Antarctic sea ice extent was at an all-time record low of 1.924 million km², as the above image shows. Throughout the year, Antarctic sea ice extent has been low. On December 14, 2022, Antarctic sea ice was merely 9.864 million km² in extent. Only in 2016 was Antarctic sea ice extent lower at that time of year, and – importantly – 2016 was a strong El Niño year.
The NOAA image on the right indicates that, while we’re still in the depths of a persistent La Niña, the next El Niño looks set to strike soon.
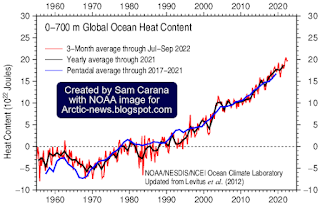
Meanwhile, ocean heat content keeps rising due to high levels of greenhouse gases, as illustrated by the image on the right.
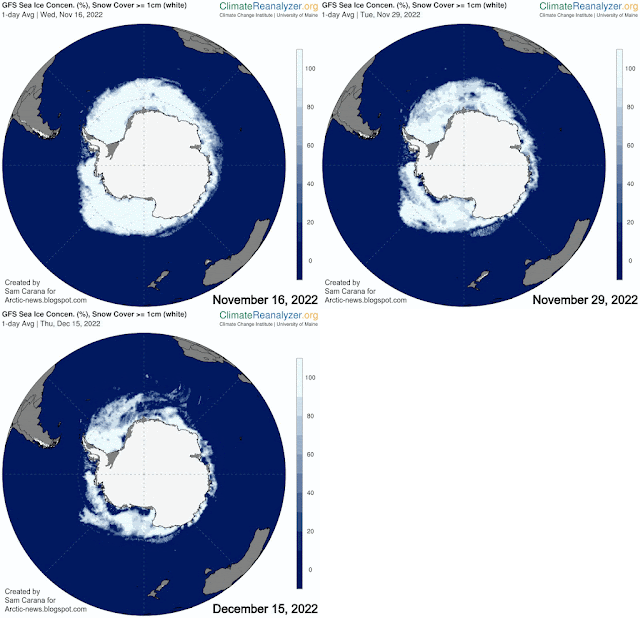
The currently very rapid decline in sea ice concentration around Antarctica is illustrated by the animation of Climate Reanalyzer images on the right, showing Antarctic sea ice on November 16, November 29 and December 15, 2022.
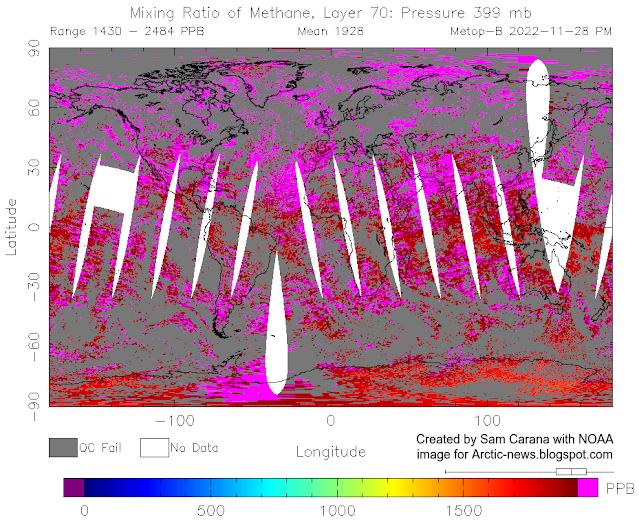
In 2012, a research team led by Jemma Wadham studied Antarctica, concluding that an amount of 21,000 Gt or billion tonnes or petagram (1Pg equals 10¹⁵g) of organic carbon is buried beneath the Antarctic Ice Sheet, as discussed in an earlier post.
“We are sleepwalking into a catastrophe for humanity. We need to take notice right now. It is already happening. This is not a wait-and-see situation anymore,” Jemma Wadham said more recently.
The situation is dire and the right thing to do now is to help avoid or delay the worst from happening, through action as described in the Climate Plan.
• NSIDC – Interactive sea ice graph
https://nsidc.org/arcticseaicenews/charctic-interactive-sea-ice-graph
• NOAA – ENSO: Recent Evolution, Current Status and Predictions
https://www.cpc.ncep.noaa.gov/products/analysis_monitoring/lanina/enso_evolution-status-fcsts-web.pdf
• NOAA – ocean heat content
https://www.ncei.noaa.gov/access/global-ocean-heat-content/index.html
• Climate Reanalyzer sea ice concentration
https://climatereanalyzer.org/wx/todays-weather/?var_id=seaice-snowc&ortho=7&wt=1
• Potential methane reservoirs beneath Antarctica – Press release University of Bristol (2012)
https://www.bristol.ac.uk/news/2012/8742.html
• Potential methane reservoirs beneath Antarctica – by Jemma Wadham et al. (2012)
https://www.nature.com/articles/nature11374
• A new frontier in climate change science: connections between ice sheets, carbon and food webs
• Climate Plan
https://arctic-news.blogspot.com/p/climateplan.html


